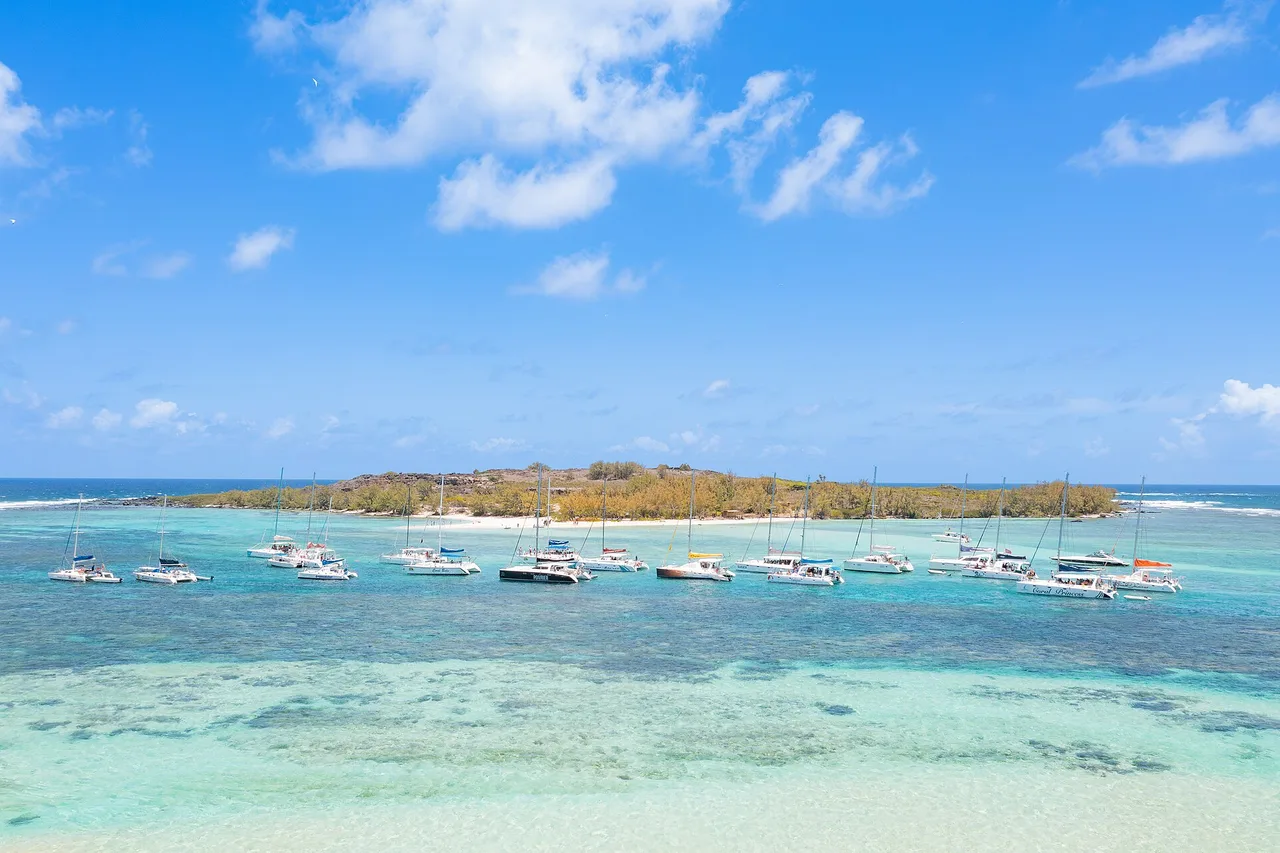
Seven in the morning on the east coast, in the middle of the southern winter. Clear sky, perfect sand — and a lagoon streaked with whitecaps all the way to the reef. The south-east trade wind picked up overnight, so the mask and snorkel stay in the bag. An hour’s drive away, on the leeward side, the same island offers a sheet of glass. That morning comes round ten times a season, and it is exactly why I built the Live Conditions screen in the app. Because the real question here is never “is the weather good in Mauritius?” — it is “where, today, is the sea actually workable?”
Budget tip: in Mauritius, part of your activities can cost you less. See how to save money with discounts on your activities.
I live in Mauritius and I built Moris Insider, the island’s guide and map. This article is about one feature only: Live Conditions. What it shows, what it saves me — and, just as importantly, what it cannot do.
Seven in the morning, and the wind has already decided
Mauritius is 65 kilometres long. It is tempting to assume the weather is “the same everywhere” — it is not, and in fact it is often the opposite. The island sits across the south-east trade winds, which blow for most of the year and stiffen noticeably during the southern winter, from May to September. The east and south coasts take them head-on: the swell builds, the lagoon ripples, the sand flies. The west and north coasts sit in the lee, sheltered by the central highlands — at the very same moment, forty minutes away by car, the sea there is flat.
This is not a meteorologist’s nuance. It is the difference between a morning of snorkelling and a morning spent looking at the water. And I watch travellers fall into the classic trap every day: they open a general weather app, read “showers, Mauritius”, and write off the day. Yet a Mauritian shower often lasts ten minutes, crosses one region only, and the sun comes back behind it. What actually matters comes down to three numbers: wind, swell and current, at the place you are actually going. The places themselves are all on the explorer map in the app; the question is which of them are worth it today.
What I actually do, in thirty seconds
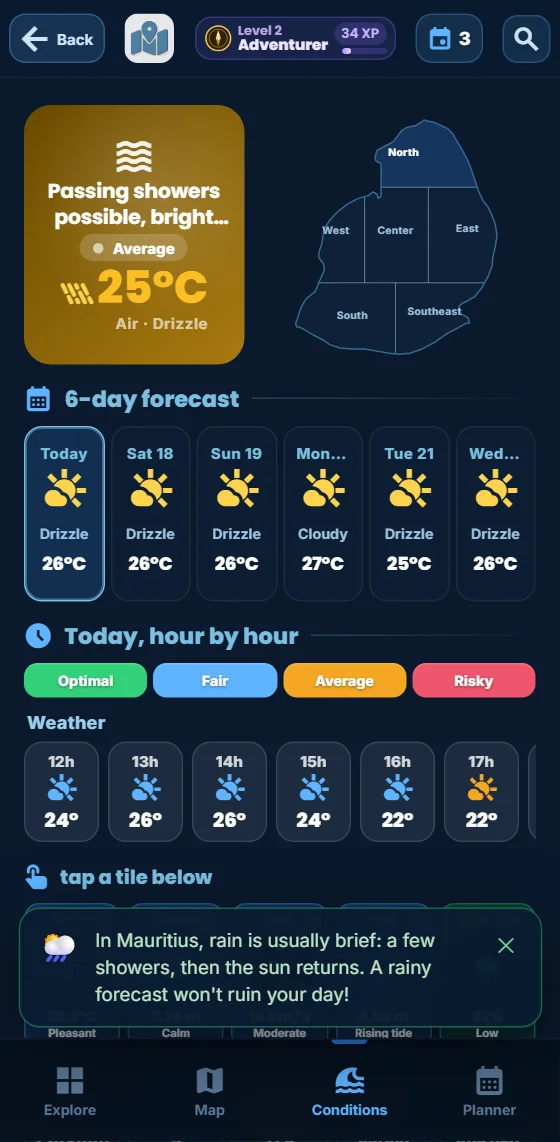
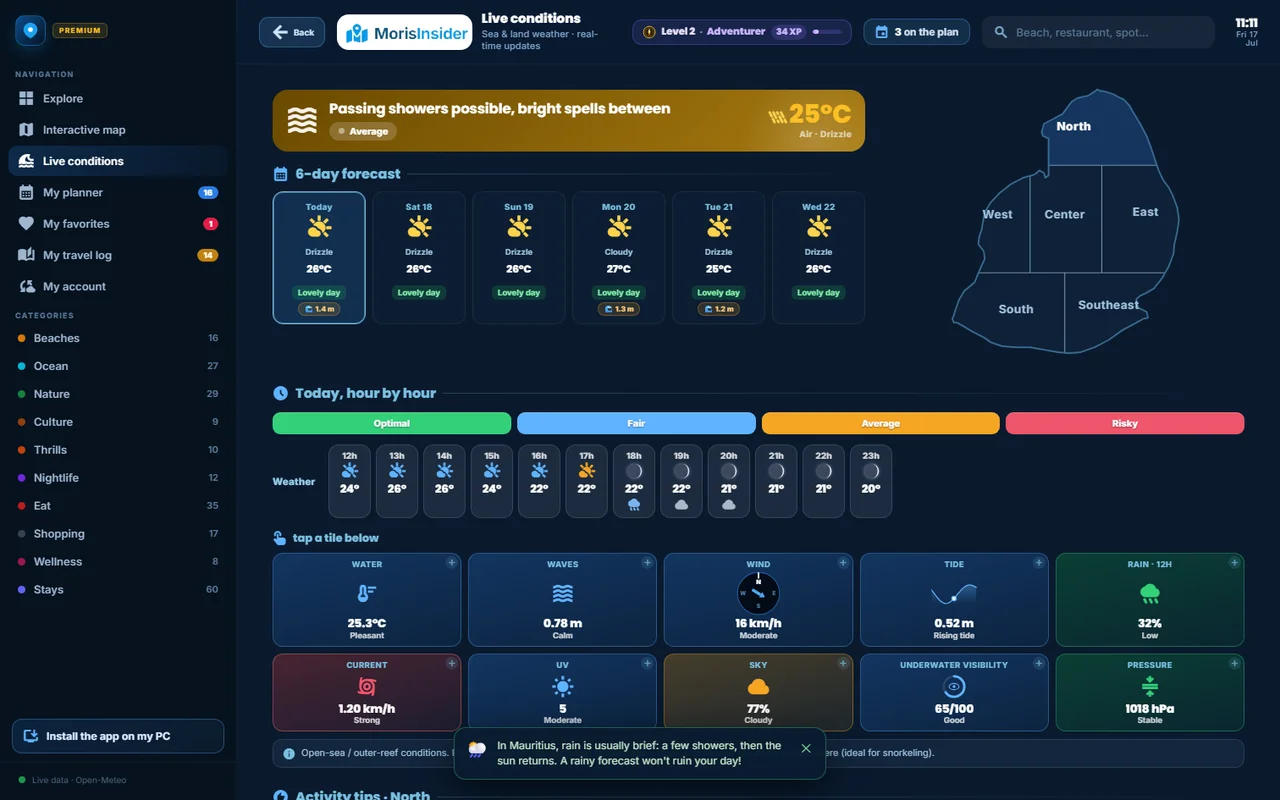
The routine never changes, and it fits inside one coffee. I open the app and tap Conditions in the bottom bar. The screen opens on the region closest to where I am — nothing to set up. At the top, a wide banner gives the verdict for the day in one sentence: “Fine day, sea workable”, “Passing showers possible”, “Lively sea”, with the air temperature beside it.
To the right of that verdict sits the outline of the island, split into regions. I tap another region and the whole screen switches: verdict, values, recommendations. That single tap is what solves my morning problem — comparing east and west in two touches, and driving to the right side. Just below, a strip of six-day forecasts: tap a day and the entire screen shows that day instead of today. That is how I move a boat trip to the day after tomorrow rather than gambling on tomorrow.
Six regions, not one island: what that changes
The feature itself, plainly stated: the app does not query “Mauritius”, it queries six real points, one per region — Grand Baie in the north, Flic en Flac in the west, Curepipe in the centre, Le Morne in the south, Mahébourg in the south-east, Belle Mare in the east. Each has its own sea and sky readings. The data comes from Open-Meteo, which aggregates the ECMWF and GFS models; the app shows the source, the time of the last update, and a confidence indicator based on the spread between the two models. When they disagree, you are told, instead of having the choice made for you.
What it allows: you get the sea and sky of the coast you are going to, not an island-wide average that matches nowhere in particular. What it changes is measured in holiday hours: you do not drive forty-five minutes to an unusable beach, you do not cancel a day because a national bulletin said “rain”, and you do not take children into a churning lagoon. One detail matters more than it sounds: when a value is missing, the app shows a dash. It never fills a gap with an estimate — an invented number would be worse than no number at all. The rest of the island is then browsed through the 225 places sorted by mood, from sheltered lagoon to ridge hike.
Full guide: Renting a Car in Mauritius: Tips & Pitfalls to Avoid
Check the sea before you pick up the car keys
The island’s six regions, their land and marine weather, and a six-day forecast. €24.90 once, for life. 30-day money-back guarantee.
Discover the app →The ten tiles, and the three that decide
Below the verdict, the screen lines up ten condition tiles: water temperature, wave height, wind, tide, rain probability, current, UV index, cloud cover, underwater visibility and atmospheric pressure. Each carries its real value plus a plain-language rating — “calm”, “moderate”, “high” — so you never need to know what 0.8 m of swell or 24 km/h of wind actually feels like.
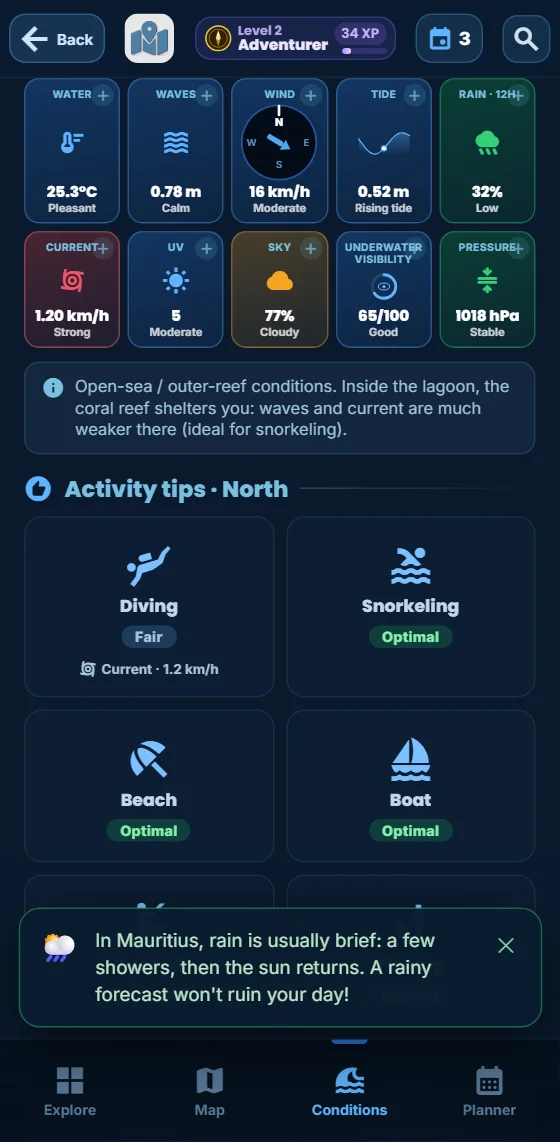
In practice I look at three. Waves and current tell me whether you can get in the water; wind tells me whether the day will be comfortable on a boat and on the beach. The fourth I check often is underwater visibility: a score out of 100 combining swell, current and recent rain, which saves you from paying for a snorkelling trip on a day when you will see nothing. One essential warning, shown right under the tiles: these values are for the open sea, outside the reef. Inside the lagoon, the coral barrier breaks the swell and slows the current — conditions there are almost always gentler than the figures suggest. Under the tiles, the app also rates what suits the chosen region that day: diving, snorkelling, beach, boat trip, kitesurfing, fishing, hiking, viewpoint. Each one links through to the matching spots in the Ocean category. If you are still choosing a place, our best snorkelling spots cover that side of the question.
Hour by hour: the window that saves the day
A Mauritian day often turns on three hours. The wind usually gets up mid-morning and drops in the late afternoon; a shower passes between two bright spells. So the screen carries an hourly row: weather hour by hour, to which you add the measurements you want to follow — waves, wind, current, visibility, and the tide as a continuous curve. Each cell is colour-coded across four levels: optimal, fine, moderate, risky. You read the right window at a glance, without interpreting a single figure.
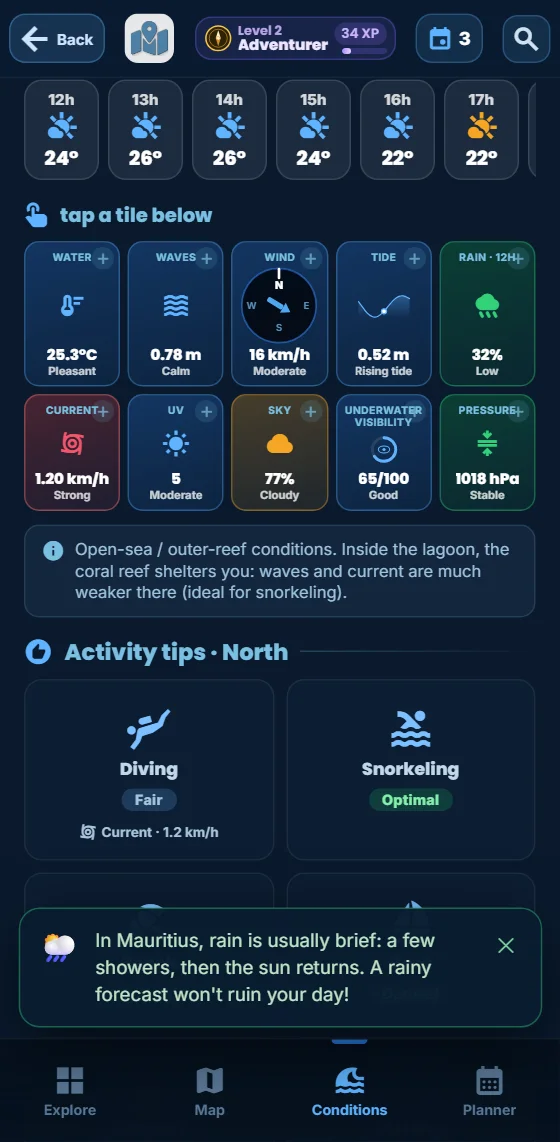
Better still: tapping an hour switches every tile to that hour. You stop thinking “today” and start thinking “at 3 p.m.”. Once the window is spotted, I drop the outing into the “My week” planner in the app, and the rest of the day arranges itself around it. To be clear on this point: the hour-by-hour detail is part of the app. The app gives the daily verdict, the six-day forecast, the ten condition tiles, the hourly colour code and the figures behind each hour and each measurement.
What Live Conditions cannot do
This is the part I insist on writing myself, because it is where trust is won or lost. These are forecasts, not measurements. There is no buoy off your beach: these are two global weather models interpolated onto one point in the region. They get things wrong, as all models do — which is exactly why the confidence indicator is displayed rather than hidden. Six points for a whole island is few: within a single region, a bay sheltered by a headland behaves differently from an exposed beach. The number gives you the trend for the coast, not the truth of your twenty metres of sand.
Three more limits, stated straight. The app is not a cyclone warning authority: official classes are issued by the Mauritius Meteorological Services, and those are the ones to follow — we explain how the island lives through its alerts in our piece on the cyclone season. Everything comes over the network: with no connection there are no conditions to show, and the app says so plainly rather than serving stale figures. Finally, the sampling stays that of the models: you will not see the squall arriving in the next ten minutes. For everything else — choosing your coast, your hour, your day — I have found nothing faster, and I have logged enough outings in the app’s travel journal to know that the good days are the ones where I checked the screen before picking up the car keys. If you are still planning your trip, our guide to the best time to visit Mauritius works at the scale of the year; this one works at the scale of the morning.
Today’s sea, coast by coast
Moris Insider brings together 225 hand-picked places, land and marine weather for the island’s six regions, and six-day forecasts. €24.90 once, for life. 30-day money-back guarantee.
Discover the app →